
Delaware Statutory Trust (DST) Historical Performance Data
Learn more about the historical performance of Delaware Statutory Trust (DST) property investments, DST investment sponsors, and Baker 1031 Investments.
Baker 1031 Investments: A History of Efficient, Consistent Performance
Baker 1031 Investments partners with institutional-quality sponsors to deliver strong, consistent results for 1031 exchange investors. Below are the aggregate performance metrics across all realized (completed) DST investments on our platform.
$4 Trillion+ AUM
Our platform’s sponsors manage more than $4T of investor capital.
20.28% Return
On average, our platform’s sponsors have returned 20.28% annually.
1.78x Multiple
Investors have, on average, received a 1.78x multiple on invested capital.
3.08 Years
On average, our platform has returned capital in 3.08 years.
DSTs vs. Other Investments
Even before factoring in real estate's tax advantages, Delaware Statutory Trust (DST) investments through Baker 1031 Investments outperform other investment types.
Regardless of whether you are in a 1031 exchange or not, DSTs may be an attractive alternative to add to your investment portfolio.
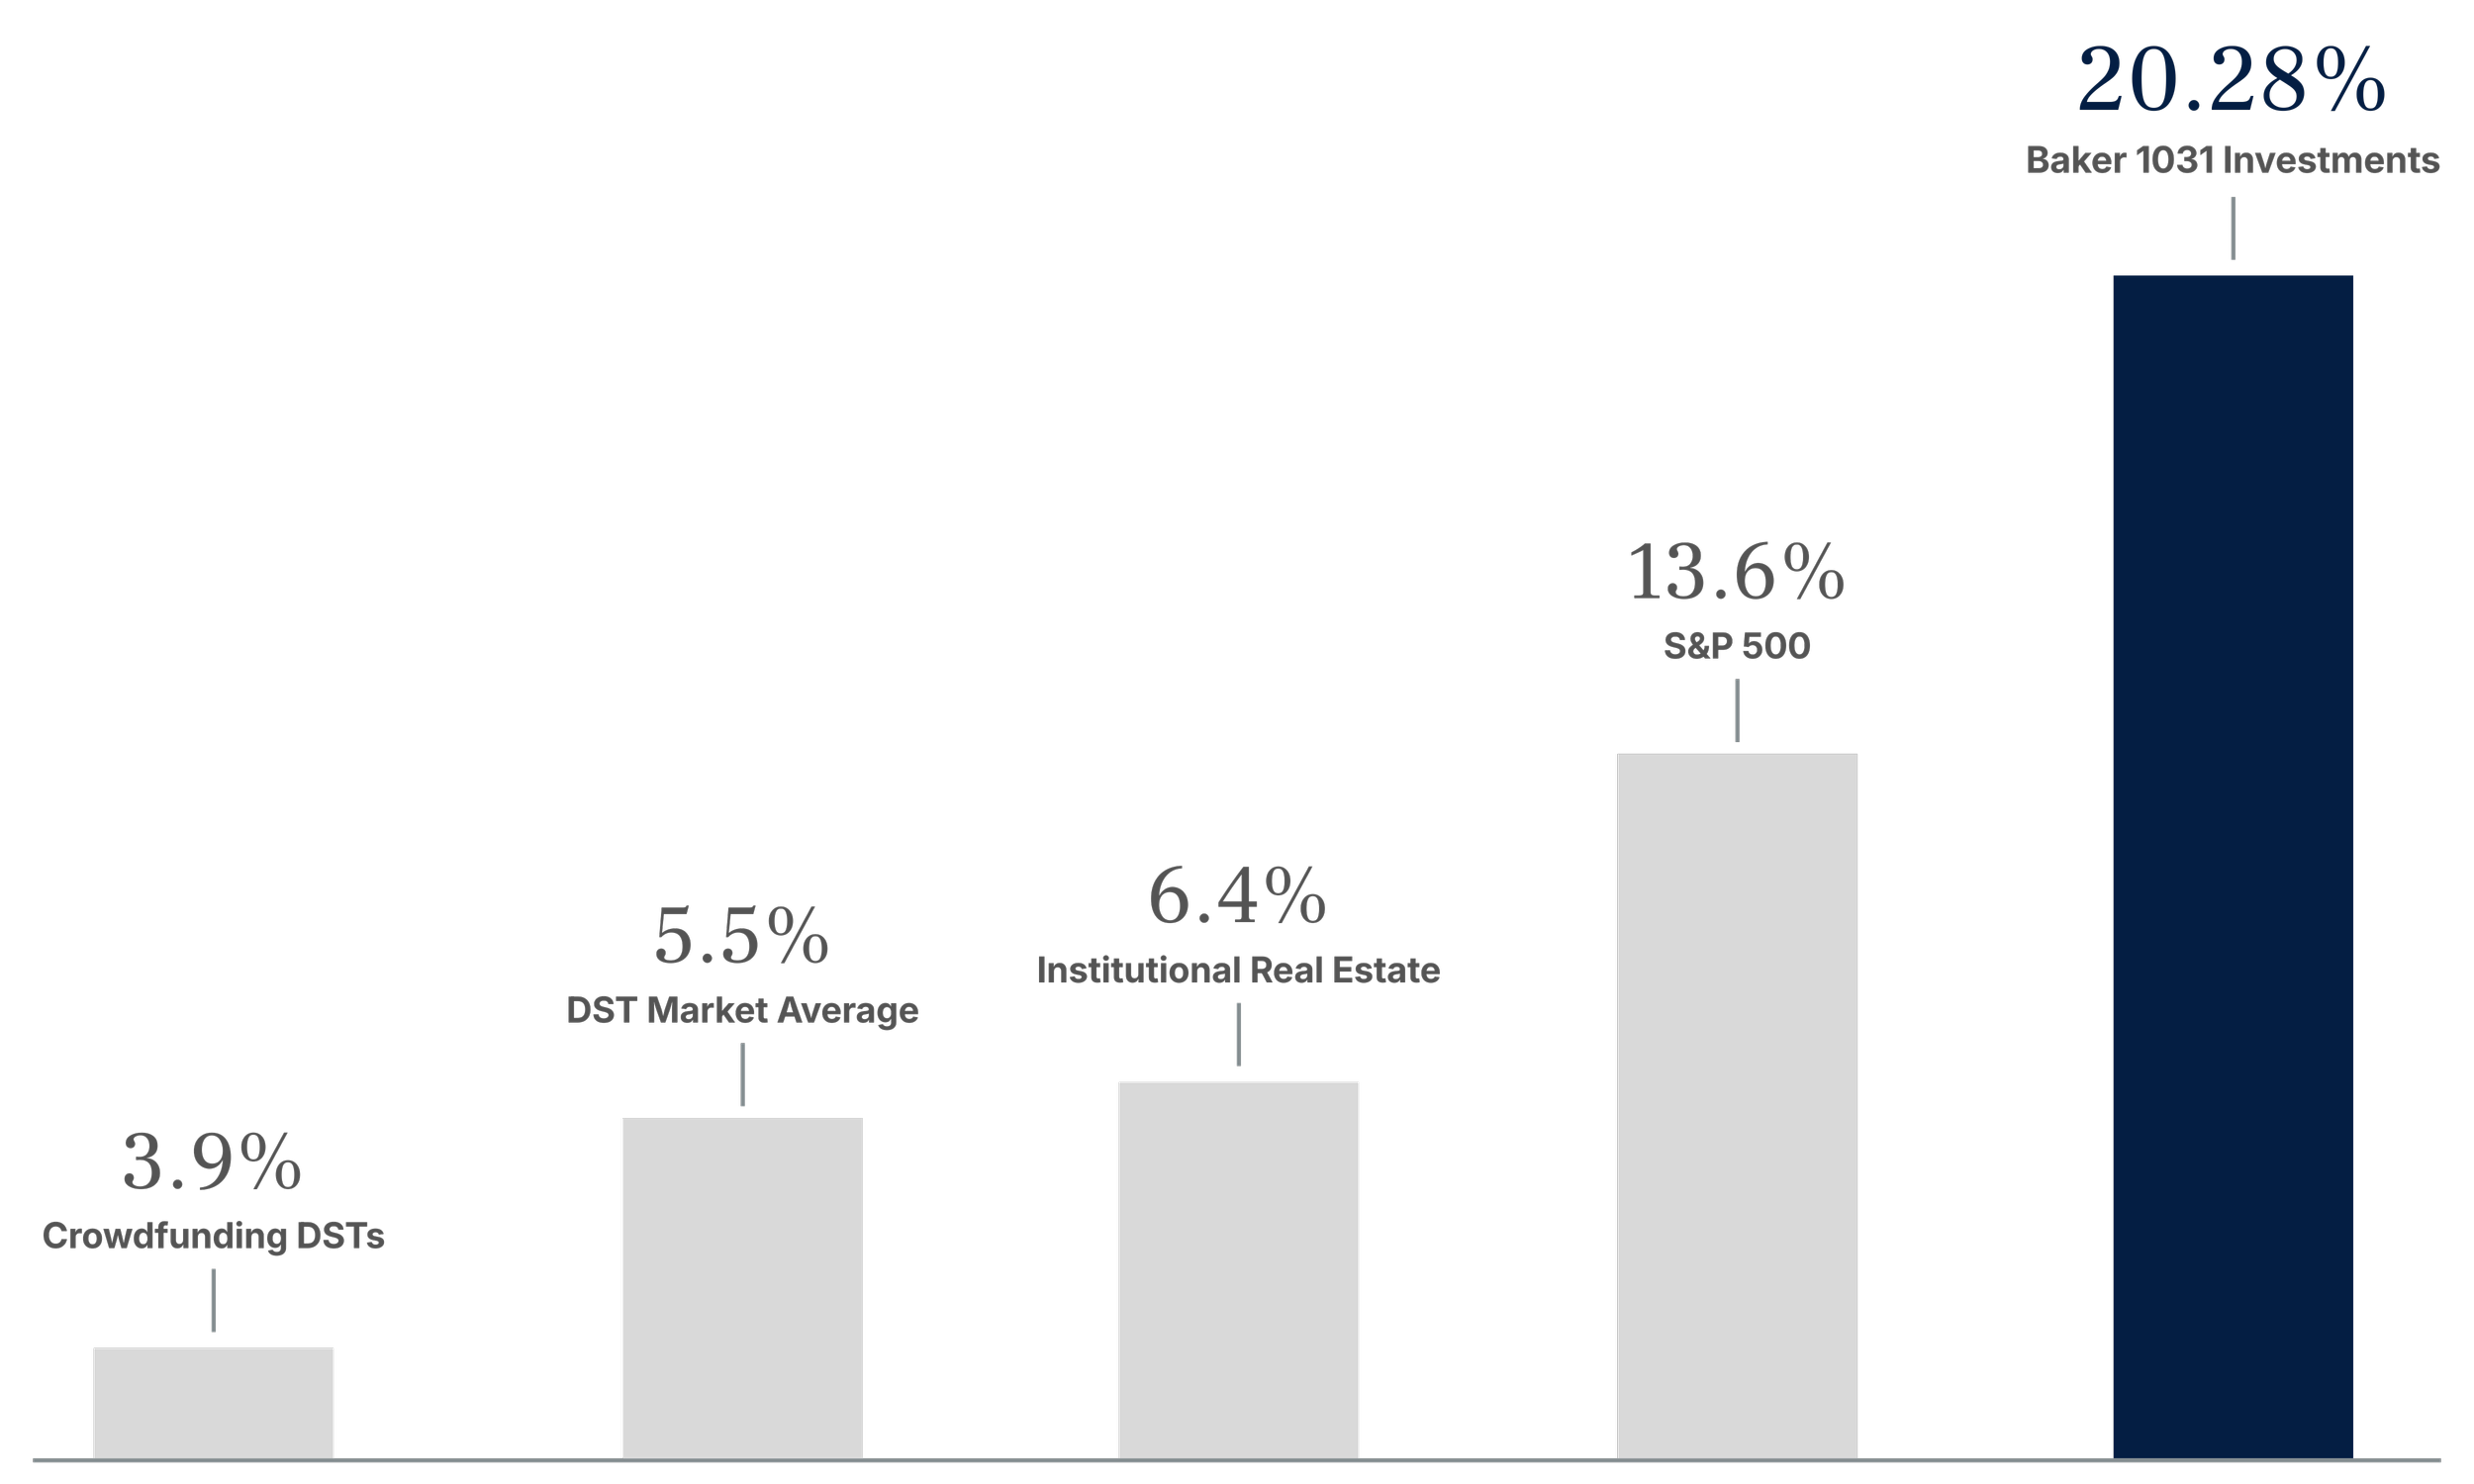
Average Annual Return by Investment Type
Comparing DSTs
Because Baker 1031 Investments performs thorough due diligence of all investment sponsor firms and investment offerings, our clients have historically outperformed the DST market average by nearly 1.8x.
Our history of outperformance is one of the many reasons why over 250,000 investors have chosen Baker 1031 Investments for their DST education, transaction, and advisory needs.
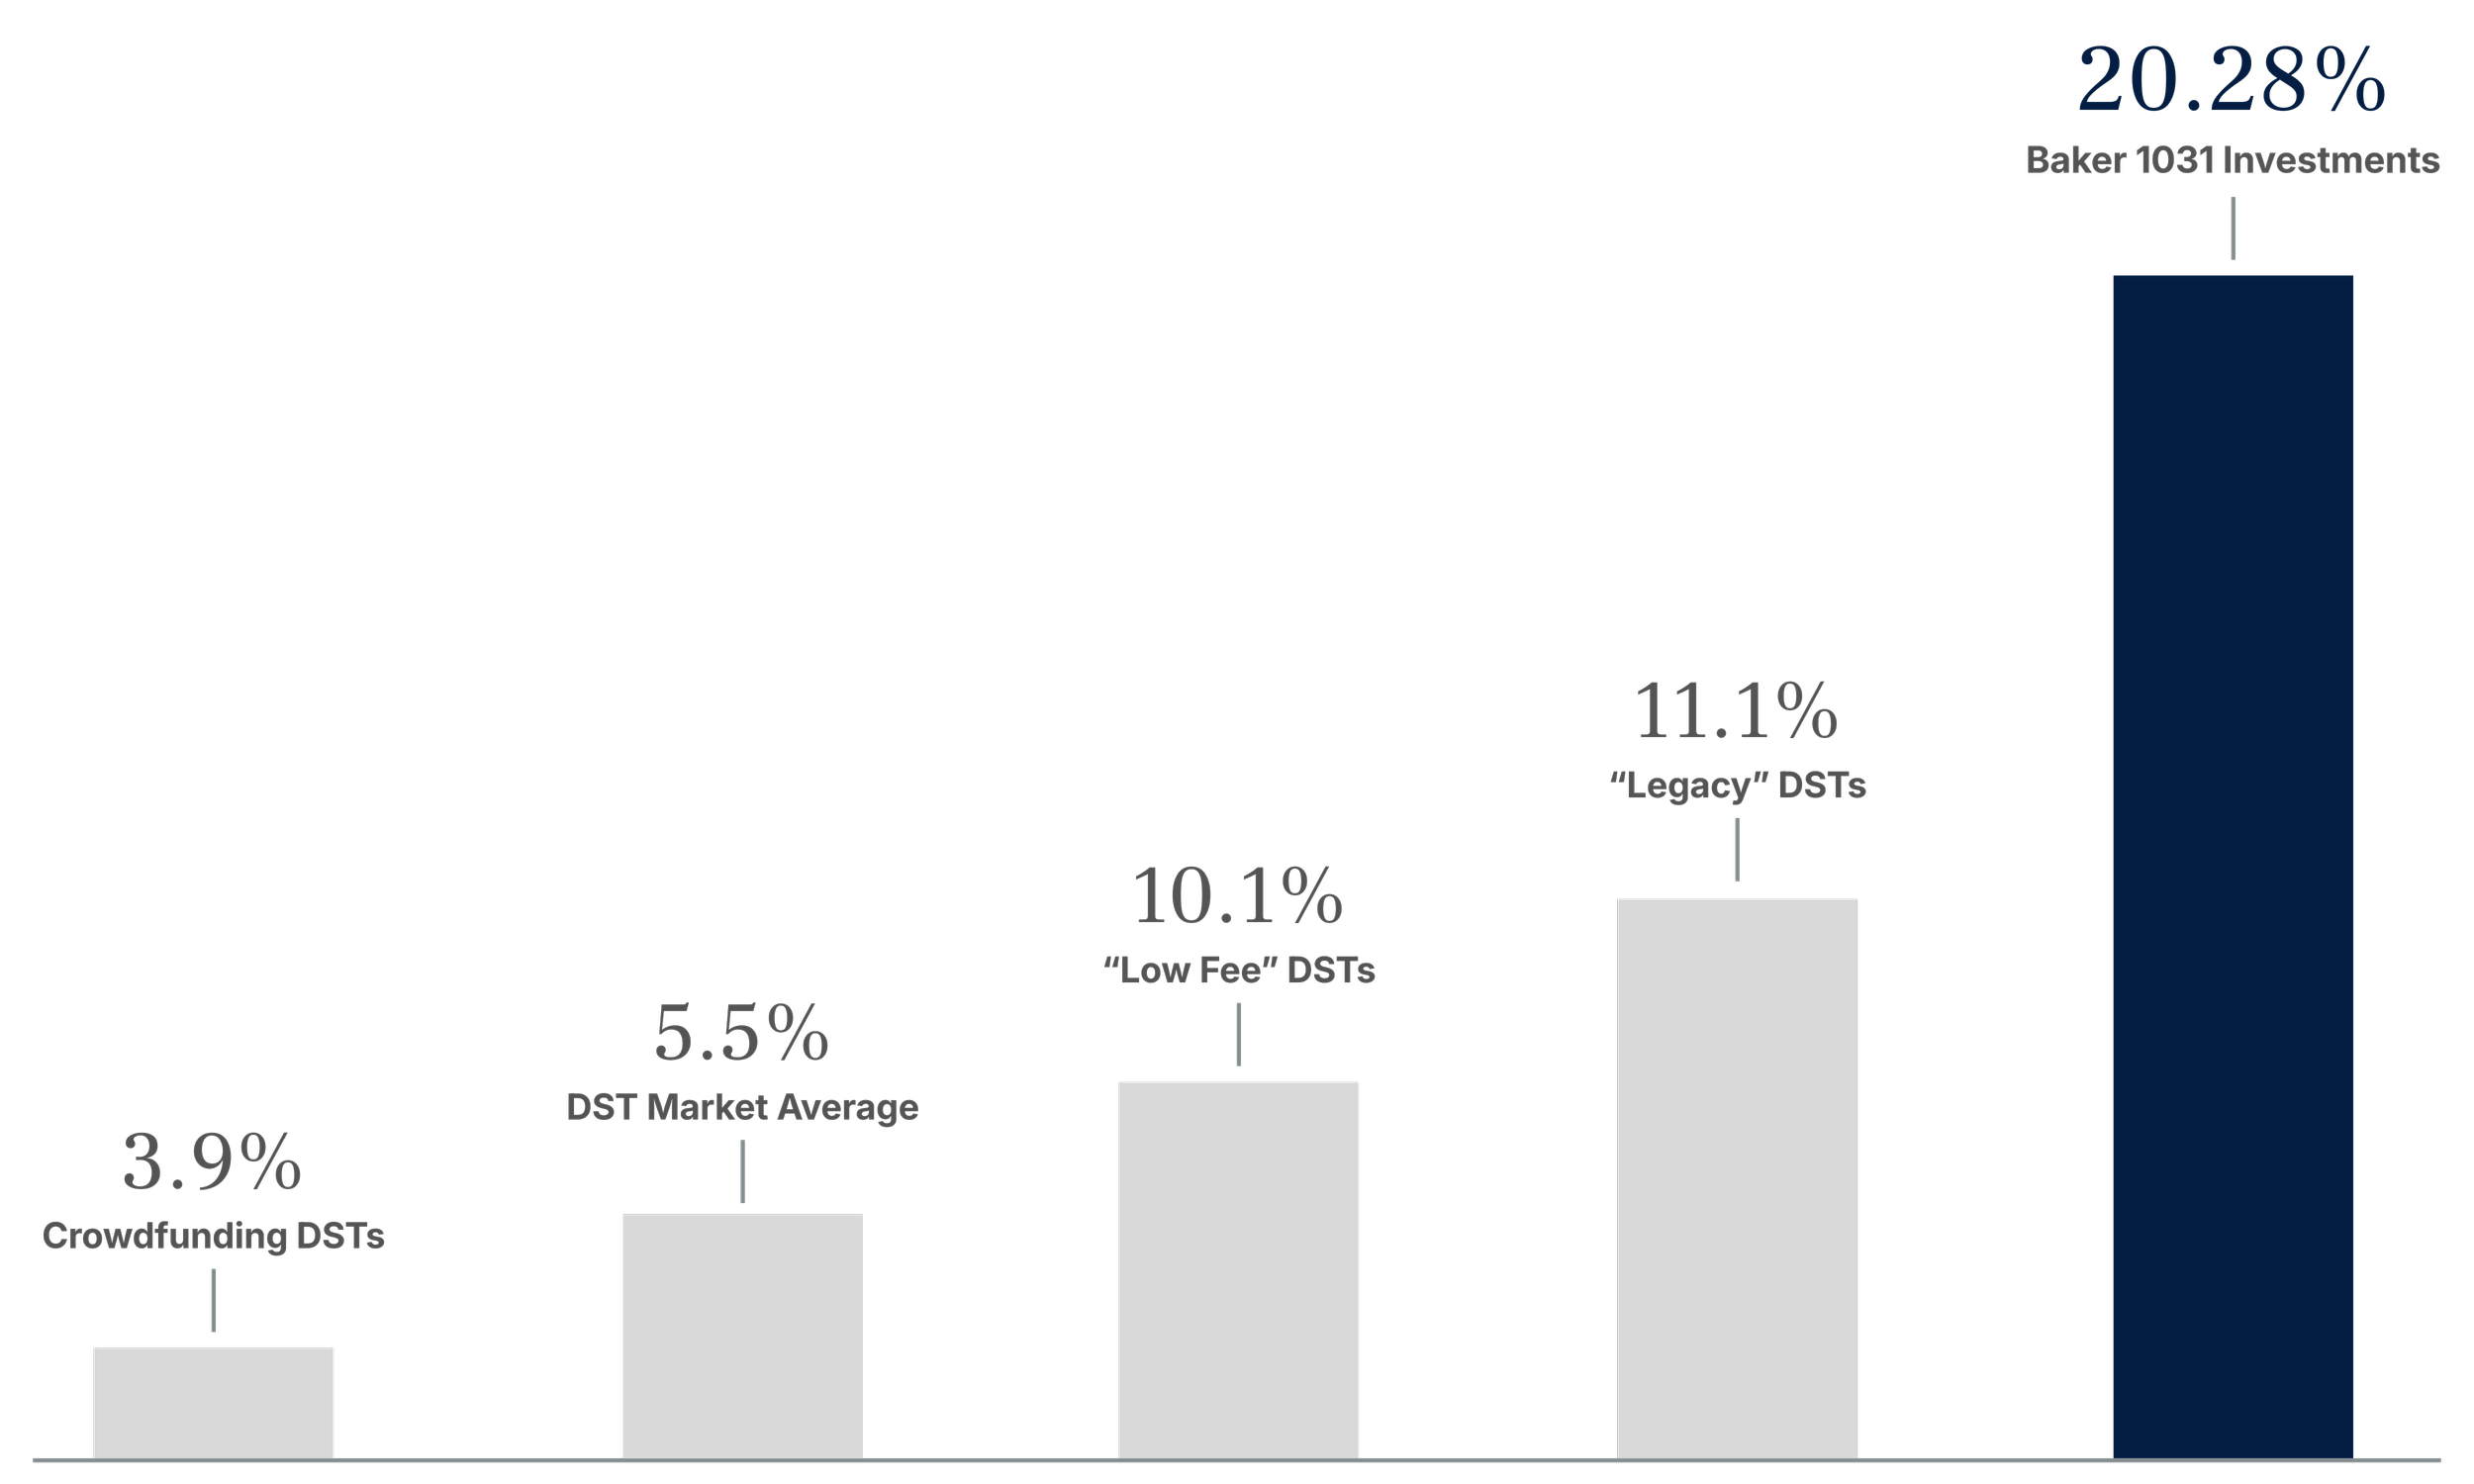
Average Annual Return by DST Category
Securing Your Investment
For many real estate investors, moving from active to passive ownership raises one big concern: risk of loss. At Baker 1031 Investments, we understand the hard work behind your real estate portfolio.
Thanks to our strict due diligence process, our investment platform has a lower risk of loss than traditional property ownership. It also carries less risk than bonds, equities, and other alternative investments.
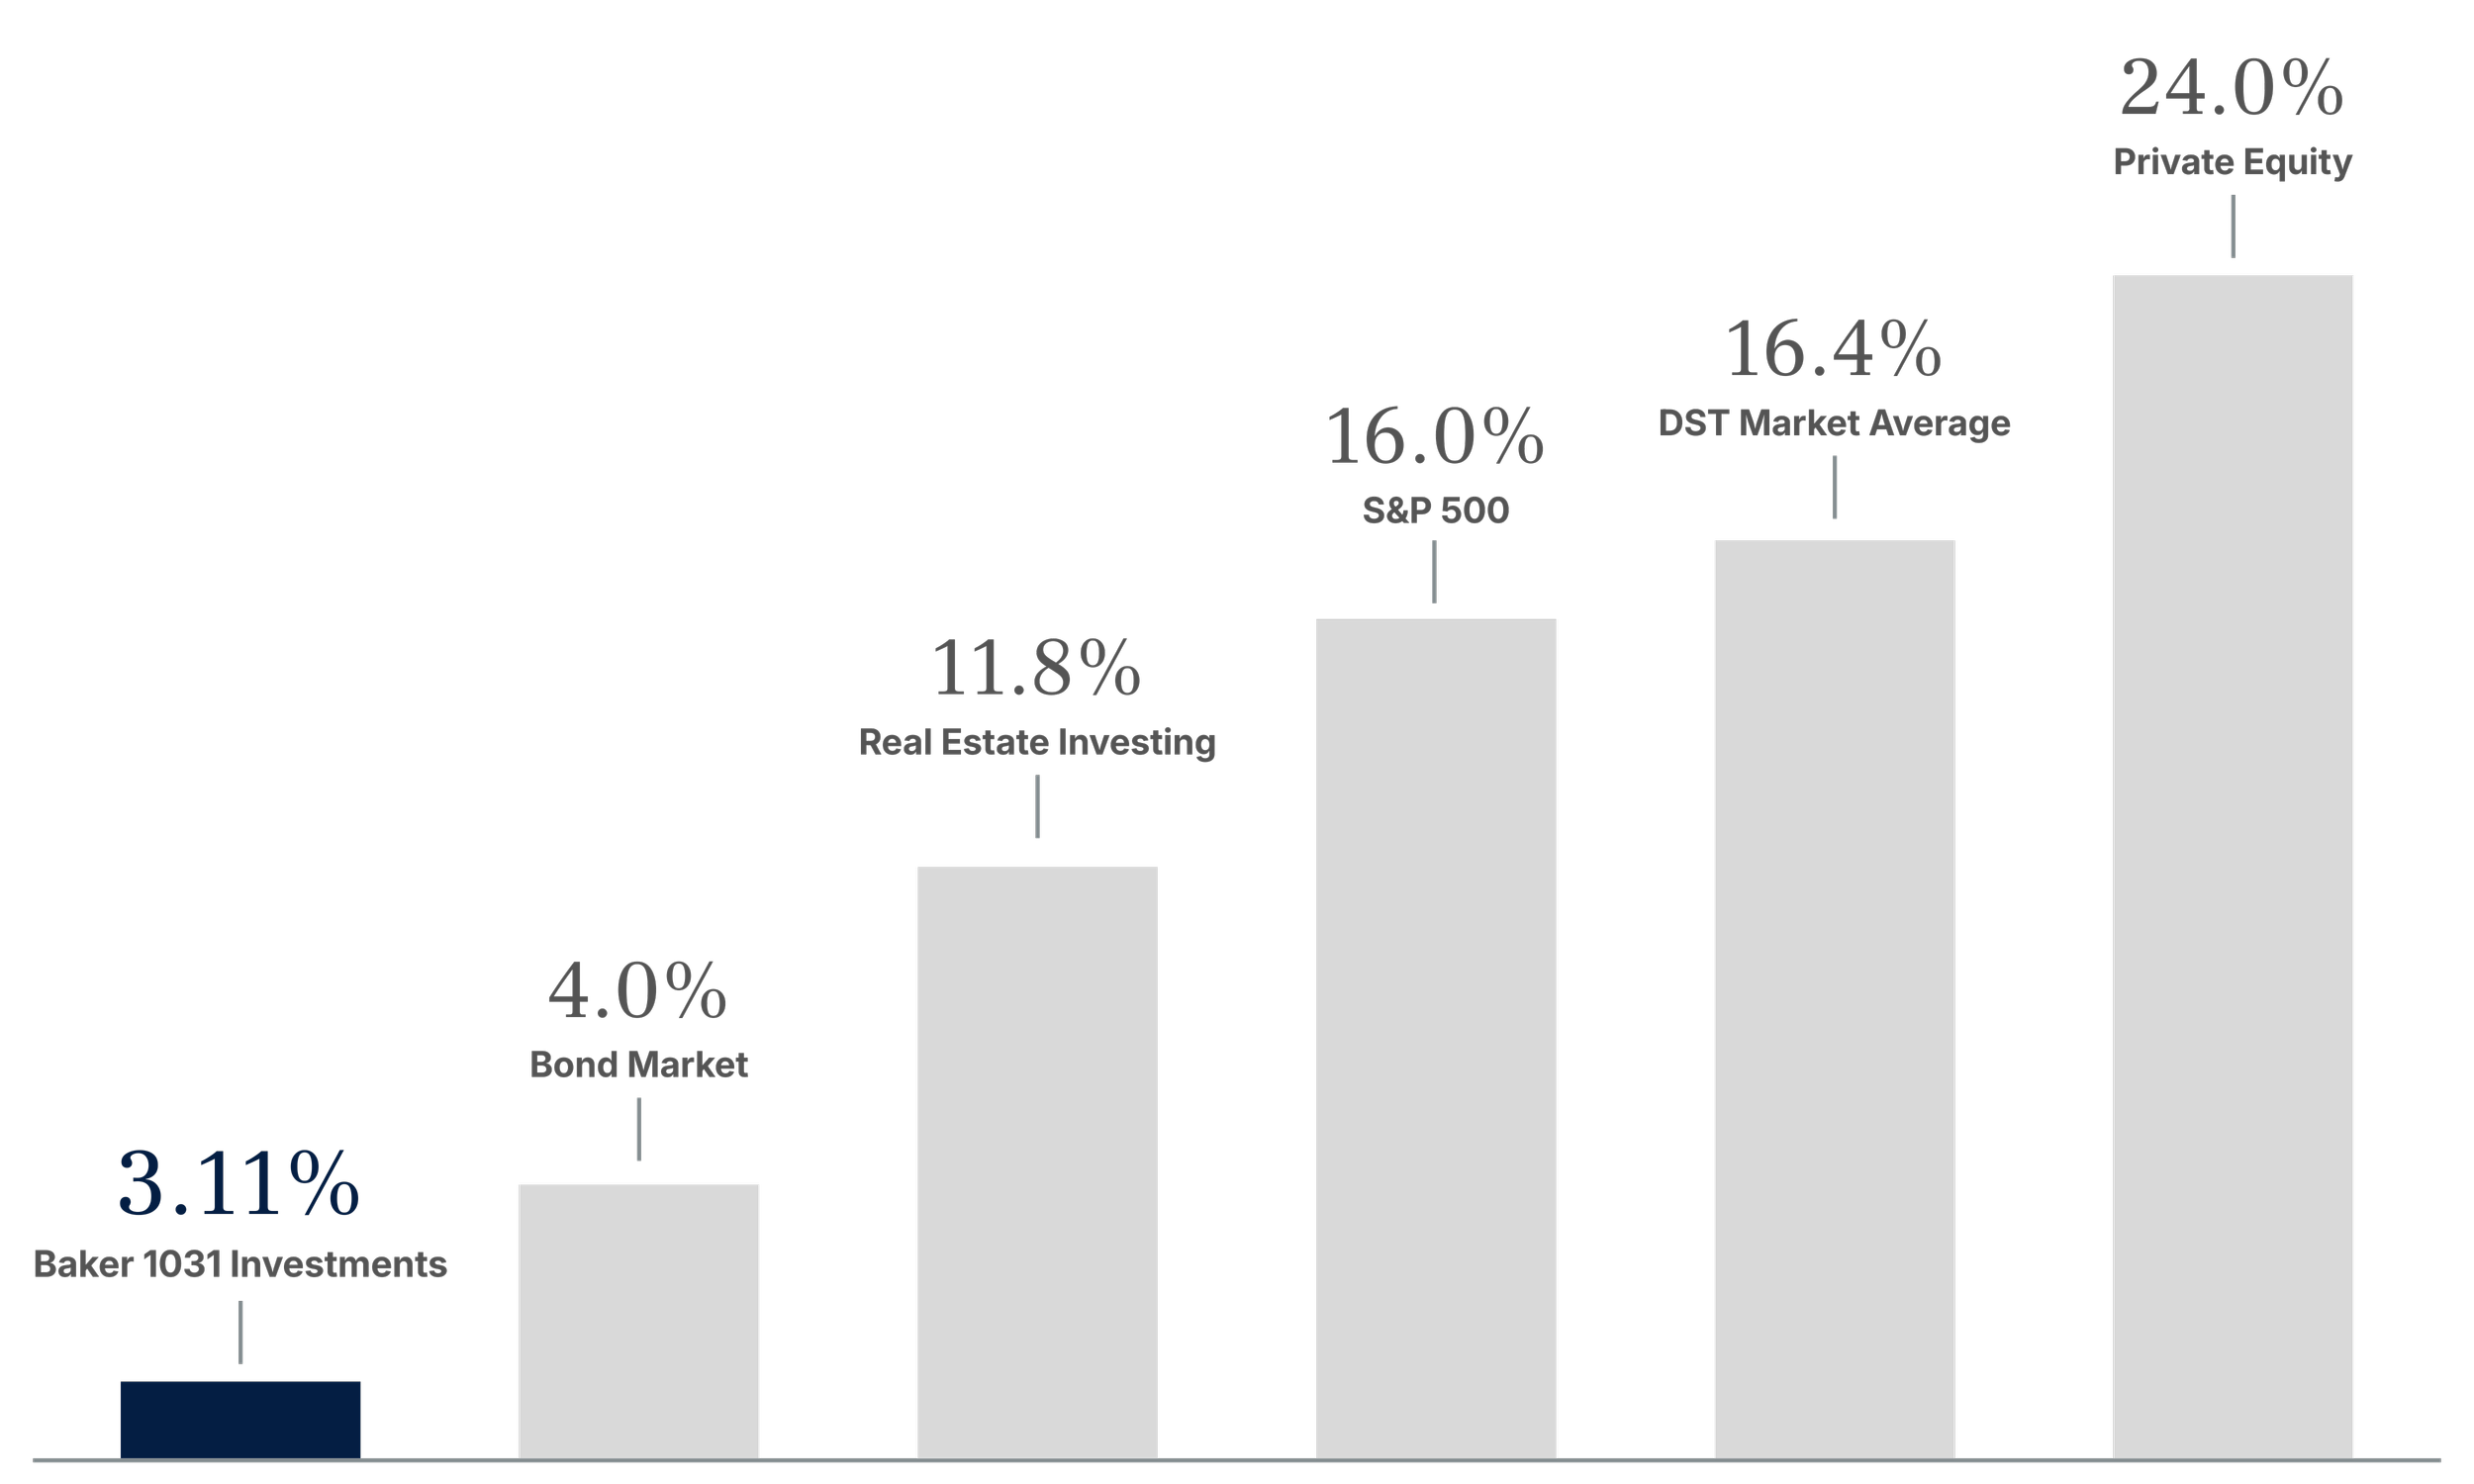
Risk of Negative Return Over 3-Year Rolling Period
DST Investment Sponsors
Baker 1031 Investments strategically selects investment sponsors with whom to partner, based on a strict and perpetual due diligence process.
Learn more about our most common institutional partners, who help us provide attractive opportunities to our clients.
-
Overview
Firm Headquarters: Los Angeles, CA
Firm Assets Under Management (AUM): $1 Trillion
Performance Data
Net Annual Rate of Return (ARR): 9.37%
Equity Multiple: 1.47x
Average Hold Period: 3.27 Years
Learn More About Apollo →
-
Overview
Firm Headquarters: New York, NY
Firm Assets Under Management (AUM): $1.8 Billion
Performance Data
Net Annual Rate of Return (ARR): 22.20%
Equity Multiple: 1.81x
Average Hold Period: 3.83 Years
Learn More About Bluerock →
-
Overview
Firm Headquarters: Dallas, TX
Firm Assets Under Management (AUM): $900 Million
Performance Data
Net Annual Rate of Return (ARR): 32.89%
Equity Multiple: 2.59x
Average Hold Period: 3.20 Years
Learn More About BridgeView →
-
Overview
Firm Headquarters: New York, NY
Firm Assets Under Management (AUM): $1 Trillion
Learn More About Brookfield →
-
Overview
Firm Headquarters: Glen Allen, VA
Firm Assets Under Management (AUM): $8.9 Billion
Performance Data
Net Annual Rate of Return (ARR): 12.14%
Equity Multiple: 1.63x
Average Hold Period: 5.78 Years
Learn More About Capital Square →
-
Overview
Firm Headquarters: Pasadena, CA
Firm Assets Under Management (AUM): $7.1 Billion
Performance Data
Net Annual Rate of Return (ARR): 8.60%
Equity Multiple: 1.45x
Average Hold Period: 5.18 Years
Learn More About ExchangeRight →
-
Overview
Firm Headquarters: El Segundo, CA
Firm Assets Under Management (AUM): $23 Billion
Performance Data
Net Annual Rate of Return (ARR): 17.64%
Equity Multiple: 1.64x
Average Hold Period: 2.9 Years
Learn More About Griffin Capital →
-
Overview
Firm Headquarters: Atlanta, GA
Firm Assets Under Management (AUM): $2.23 Trillion
Learn More About Invesco →
-
Overview
Firm Headquarters: Nashua, NH
Firm Assets Under Management (AUM): $9.2 Billion
Performance Data
Net Annual Rate of Return (ARR): 8.72%
Equity Multiple: 2.74x
Average Hold Period: 10.82 Years
Learn More About Net Lease Capital →
-
Overview
Firm Headquarters: Atlanta, GA
Firm Assets Under Management (AUM): $15 Billion
Performance Data
Net Annual Rate of Return (ARR): 21.30%
Equity Multiple: 1.78x
Average Hold Period: 2.38 Years
Learn More About Peachtree →
-
Overview
Firm Headquarters: Dallas, TX
Firm Assets Under Management (AUM): $186 Million
Performance Data
Net Annual Rate of Return (ARR): 12.24%
Equity Multiple: 1.62x
Average Hold Period: 5 Years
Learn More About Resource Royalty →
Continue Learning About 1031 Exchange Investments


-
The statement that "Nearly 30% of all experienced real estate investors " is a market share estimate derived from an analysis of third-party market data as of October 2025, representing the proportional relationship between the Baker 1031 Investment investor database and an estimated total market of active real estate investors; this estimate is based on Crexi reporting a 2,000,000 user base, 80% of whom are assumed not to be agents/brokers, and 42% of activity dedicated to investment sales, from which a conservative assumption excludes 15.7% as non-investor service providers (e.g., appraisers, lenders), resulting in an estimated active investor market of 566,664; as the Baker 1031 Investment database comprises over 170,000 individuals or entities, this figure represents 30.00% of the estimated market.
The figures and calculations provided constitute a market share estimate based on unverified third-party data and internal assumptions utilized to define the estimated market; Baker 1031 Investment has not independently verified the accuracy of the underlying data, and the term "experienced real estate investors" is defined exclusively by this methodology and its internal assumptions. This communication is not a guarantee of future results, a testimonial, or a statement of performance for any investment product or service, and its accuracy is subject to the inherent limitations of the underlying data and the validity of the internal exclusion assumptions.
The calculated platform averages presented reflect a statistical average of data provided by the specific investment sponsors listed here. The figures used in these averages are collected from self-reported statistics provided directly by the respective firms within their Private Placement Memorandums (PPMs). This information is provided solely for illustrative and educational purposes and is not intended to serve as the basis for any investment decision, nor does it constitute investment advice, a recommendation, or an offer to sell or a solicitation of an offer to buy any security.
Due to the nature of self-reporting, the data presented may be incomplete, unverified, or subject to correction, and we make no representation or warranty as to its accuracy, completeness, or timeliness. Past performance is not indicative of future results, and all investments involve risk, including the possible loss of principal. The platform average represents a limited sample, and results from individual sponsors may vary materially. For complete underlying data, data from other investment sponsors, and/or additional detail, please contact us directly. The selection of results shown are a small fraction of the total amount of realized investments and are not guarantees of future results. There are often differences between the performance results and the actual results shown and other investments' outcomes. Delaware Statutory Trust (DST) investments are subject to volatility and loss of investor principal.
S&P 500 performance data per St. Louis FRED, all-time average S&P 500 data. “Low Fee” DST data per Origin Investments Growth Fund III, accessed November 6, 2025. Privately Owned Real Estate data per Fundrise, accessed November 6, 2025. Other DST Firms data per Inland historical returns, accessed November 6, 2025. Institutional Real Estate per Invesco Active U.S. Real Estate ETF accessed November 6, 2025. Real Estate Crowdfunding data per Fundrise, accessed November 6, 2025.